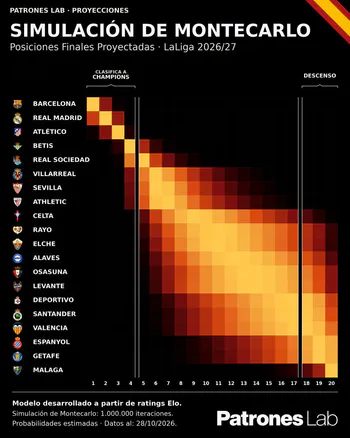

LaLiga 2026/27 · Heatmap of final standings
Heatmap of projected final positions for LaLiga teams from one million Monte Carlo simulations.
View post ↗Heatmap of projected final positions for LaLiga teams from one million Monte Carlo simulations.
View post ↗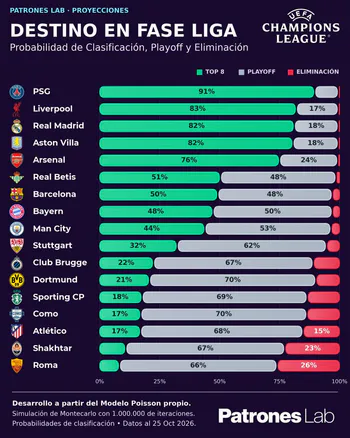
Poisson and Monte Carlo simulations estimate the chances of a top-eight finish, playoffs or elimination.
View post ↗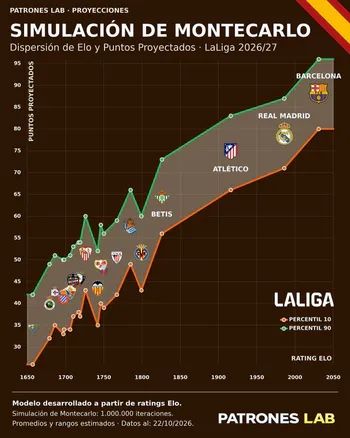
Comparison of Elo ratings, projected points and simulated result ranges for each team.
View post ↗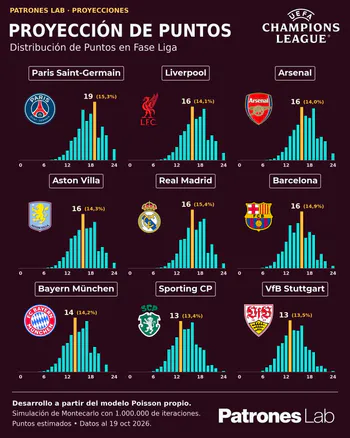
Histograms of simulated points highlight the competition's most frequent outcomes.
View post ↗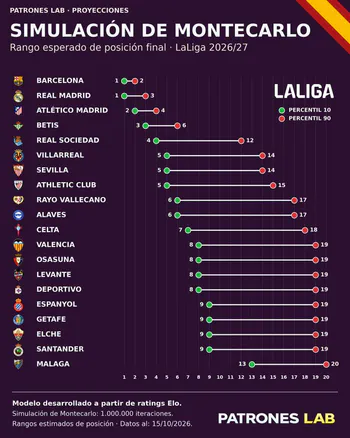
Position percentiles show the range of likely final standings.
View post ↗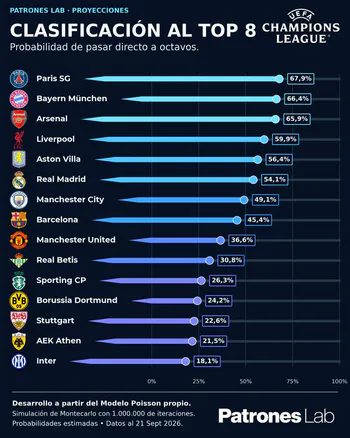
Introduction to the Poisson model and Monte Carlo simulation used to estimate match outcomes and standings.
View post ↗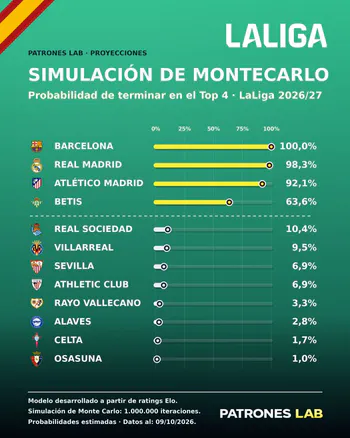
LinkedIn post about simulations. The specific details have not yet been verified.
View post ↗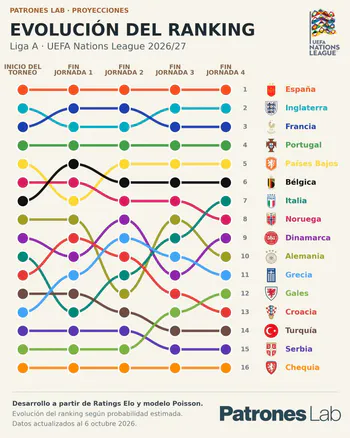
How projected national-team rankings evolve across competition matchdays.
View post ↗

Poisson goal model and Monte Carlo simulations to project Champions League outcomes.
View project in progress ↗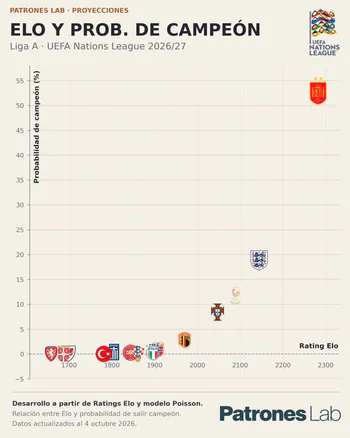
Comparing Elo ratings with each national team's estimated chance of winning the Nations League.
View post ↗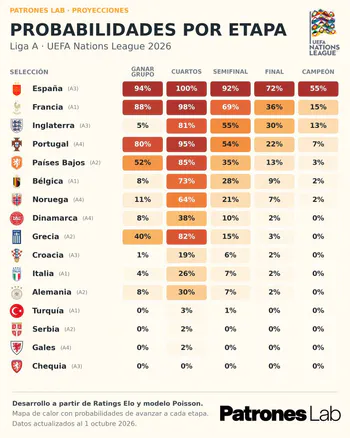
Chances of advancing through each stage, from the group phase to the final.
View post ↗
Overview of a simulation model for estimating UEFA Nations League probabilities.
View post ↗
Analysis of air traffic in the Balearic Islands using public AENA data.
View post ↗
Simulating probabilities of winning groups, progressing through knockouts and lifting the trophy.
View project ↗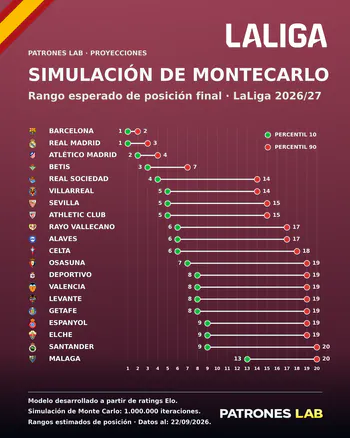
Updated final-position probabilities based on new results and Elo ratings.
View post ↗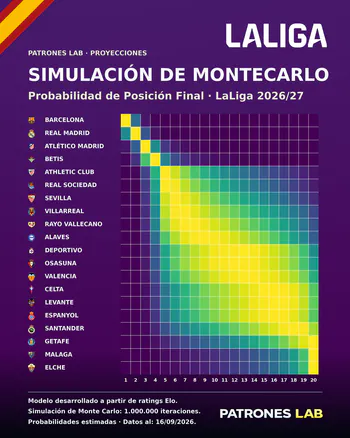
LinkedIn post about the LaLiga simulation. Details have not yet been verified.
View post ↗
Simulating scenarios to estimate final positions and outcomes in LaLiga.
View project in progress ↗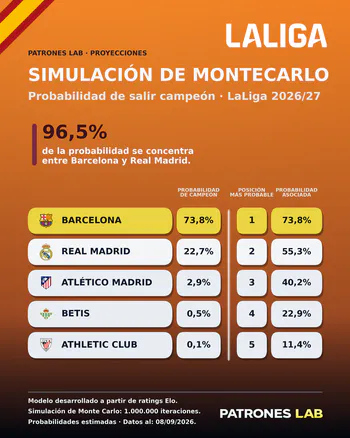
LinkedIn post about LaLiga scenarios. Details have not yet been verified.
View post ↗
Using DBSCAN to find clusters and unusual transactions in transactional data.
View post ↗
Exploring reported Chicago taxi trips to identify temporal, spatial and economic patterns.
View post ↗
Classification model to analyze transactions and signs associated with fraud.
View post ↗
Introducing Patrones Lab and its data projects, models and visualizations.
View post ↗
Comparing classification techniques to study economic losses from weather events.
View project in progress ↗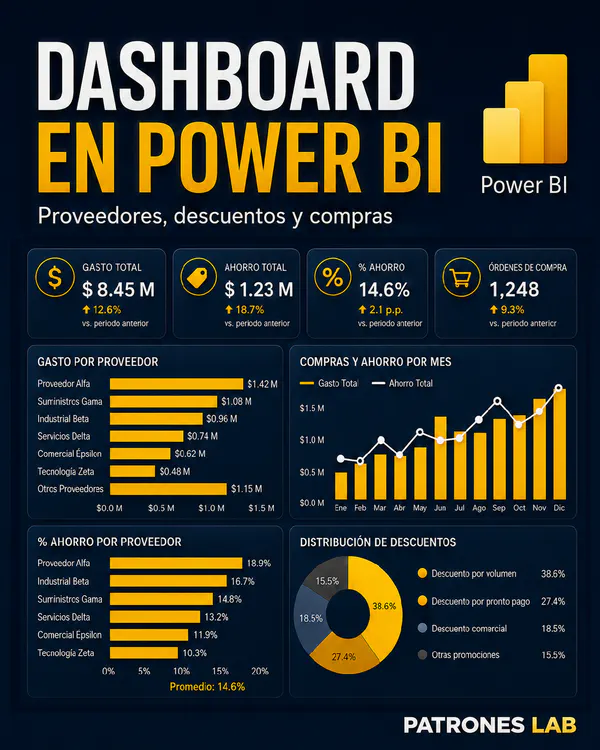
Power BI dashboard to explore supplier spending, trends, categories and regions.
View project ↗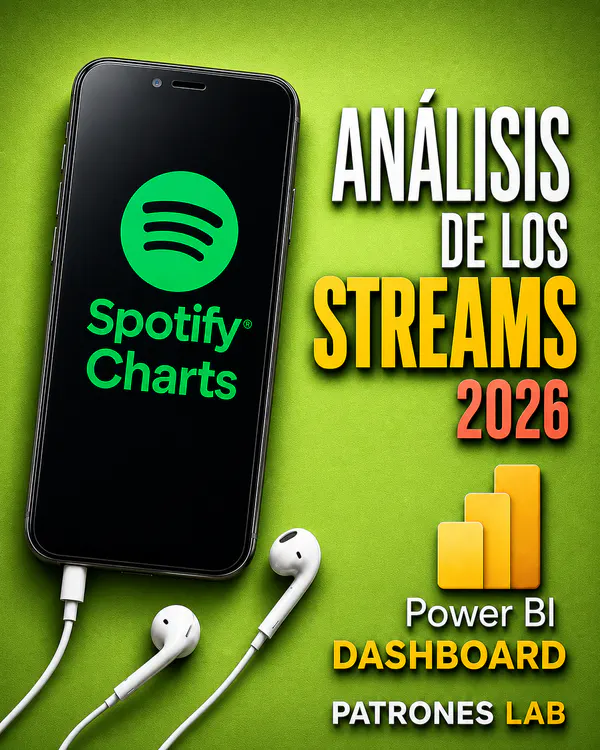
Dashboard exploring Spotify rankings, streams, trends and countries.
View project in progress ↗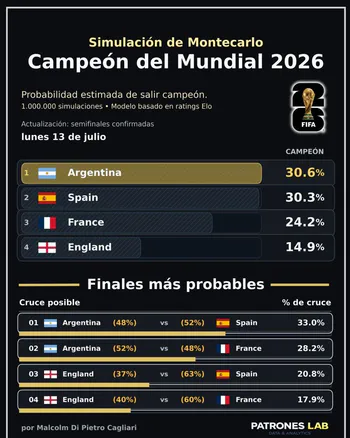
Updated World Cup winning probabilities and possible final matchups.
View post ↗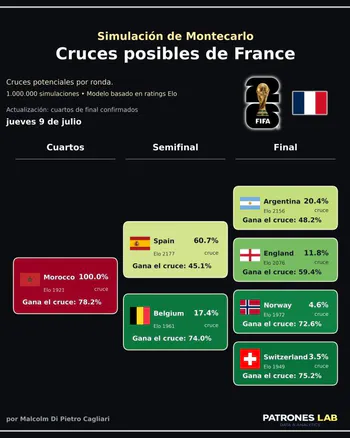
Simulated quarterfinal matchups and chances of advancing through the bracket.
View post ↗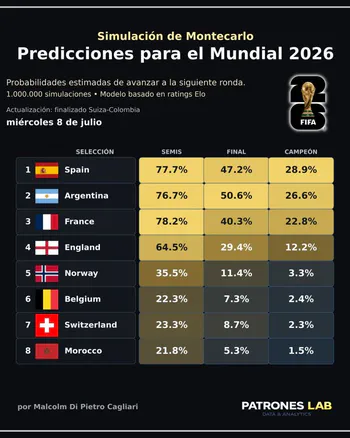
Estimated chances of reaching the semifinals, playing the final and winning the World Cup.
View post ↗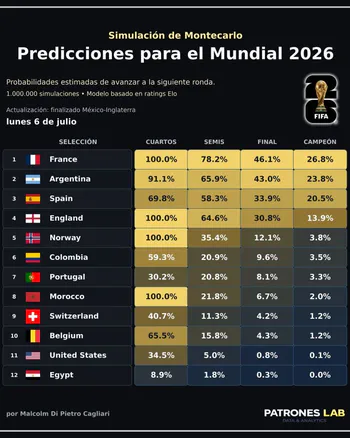
Updated chances of advancing and winning after the round of 32.
View post ↗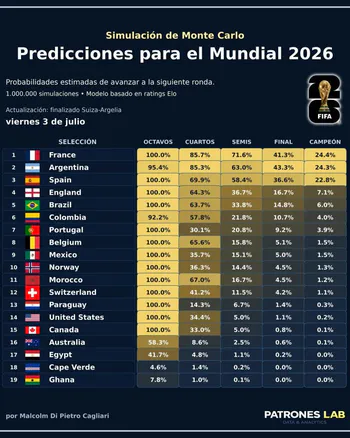
Round-by-round advancement forecasts using the results available at the time.
View post ↗
Simulation model estimating each national team's chances of advancing and winning.
View project ↗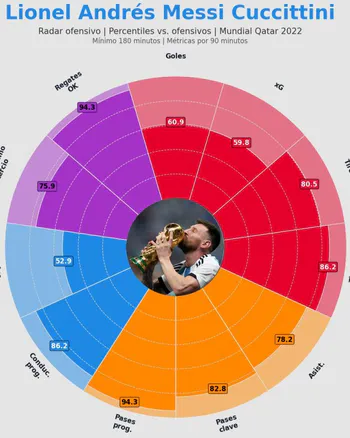
Comparing Argentine players with position-based percentiles and per-90 metrics.
View post ↗
Visual comparisons of individual performances at Qatar 2022 using percentile radar charts.
View project ↗
How on-ball actions changed attacking threat in the Argentina–France final.
View post ↗
Article on football and probabilities in the Qatar 2022 Argentina–France match.
Read article ↗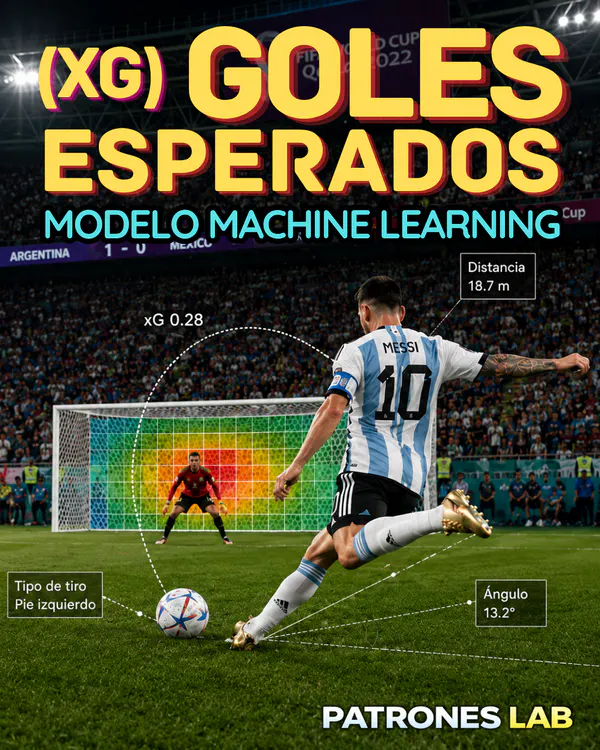
Probabilistic model estimating the scoring chance of each shot at the World Cup.
View project ↗Analysis of attacking threat generated by on-ball actions during Qatar 2022.
View project ↗
Interactive dashboard exploring demand and routes among reported Chicago taxi trips.
View post ↗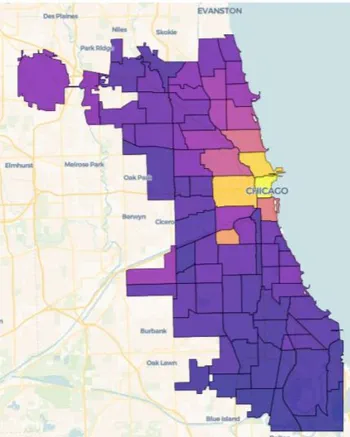
Map of trip concentration across Chicago areas based on open data.
View post ↗
Analysis of pickup and drop-off zones, routes and spatial concentration of taxi activity.
View post ↗Mapping busy zones and origin–destination flows among reported taxi trips.
View project ↗Interactive dashboard exploring taxi activity, fares and routes in Chicago.
View project ↗How reported trips vary by day, time, distance and fare.
View post ↗Article on Chicago's urban taxi-trip network based on open data.
Read article ↗Analysis of demand, routes and fares among reported Chicago taxi trips.
View project ↗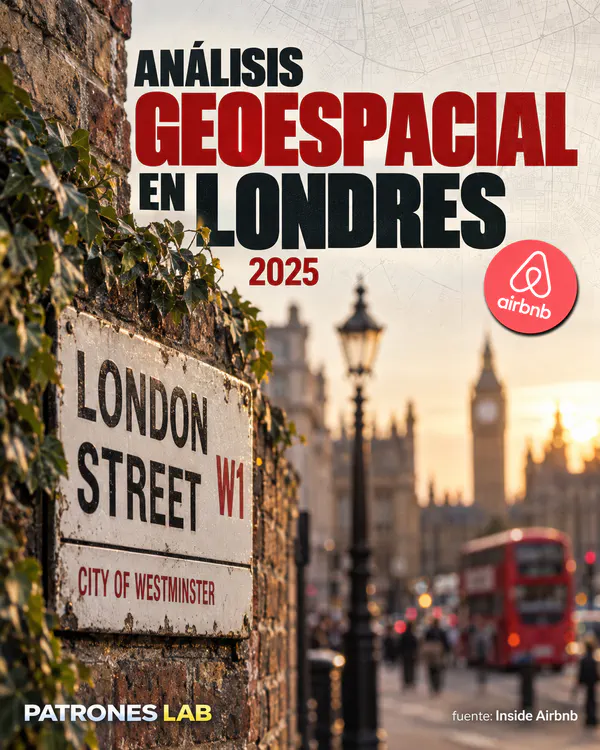
Analysis of prices by location, distance to the center and neighborhood characteristics.
View project ↗
Model classifying listings as relatively expensive or inexpensive within each room type.
View project ↗
Comparing Airbnb accommodation prices and geographic distribution across London.
View post ↗Article on London Airbnb prices and their spatial distribution.
Read article ↗Exploring accommodation prices, listing types, availability and neighborhood differences.
View project ↗Analysis of passengers, connectivity and seasonality at Balearic airports.
View post ↗Article on Balearic tourism using AENA's open aviation data.
Read article ↗Analysis of air traffic at Mallorca, Ibiza and Menorca airports using public AENA data.
View project ↗Density-based clustering to identify unusual transactions and potential fraud patterns.
View project ↗Supervised classification of transactions to estimate fraud risk and interpret relevant signals.
View project ↗
Clustering transactions with K-means to explore unusual behaviors associated with fraud.
View project ↗